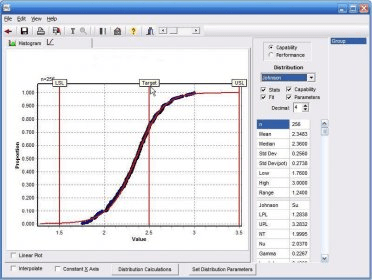
Cumulative Probability Plot does all of the statistical mathematics for you and outputs the data in a visual format that can be easily interpreted by people with a limited knowledge of statistics.
The graph is also useful for a quick demonstration to regulators or other interested parties that your product or process is within acceptable tolerance or meets regulatory limits.

Comments